Computer Vision in Archaeology
An introduction
14. 9. 2026




What you told us
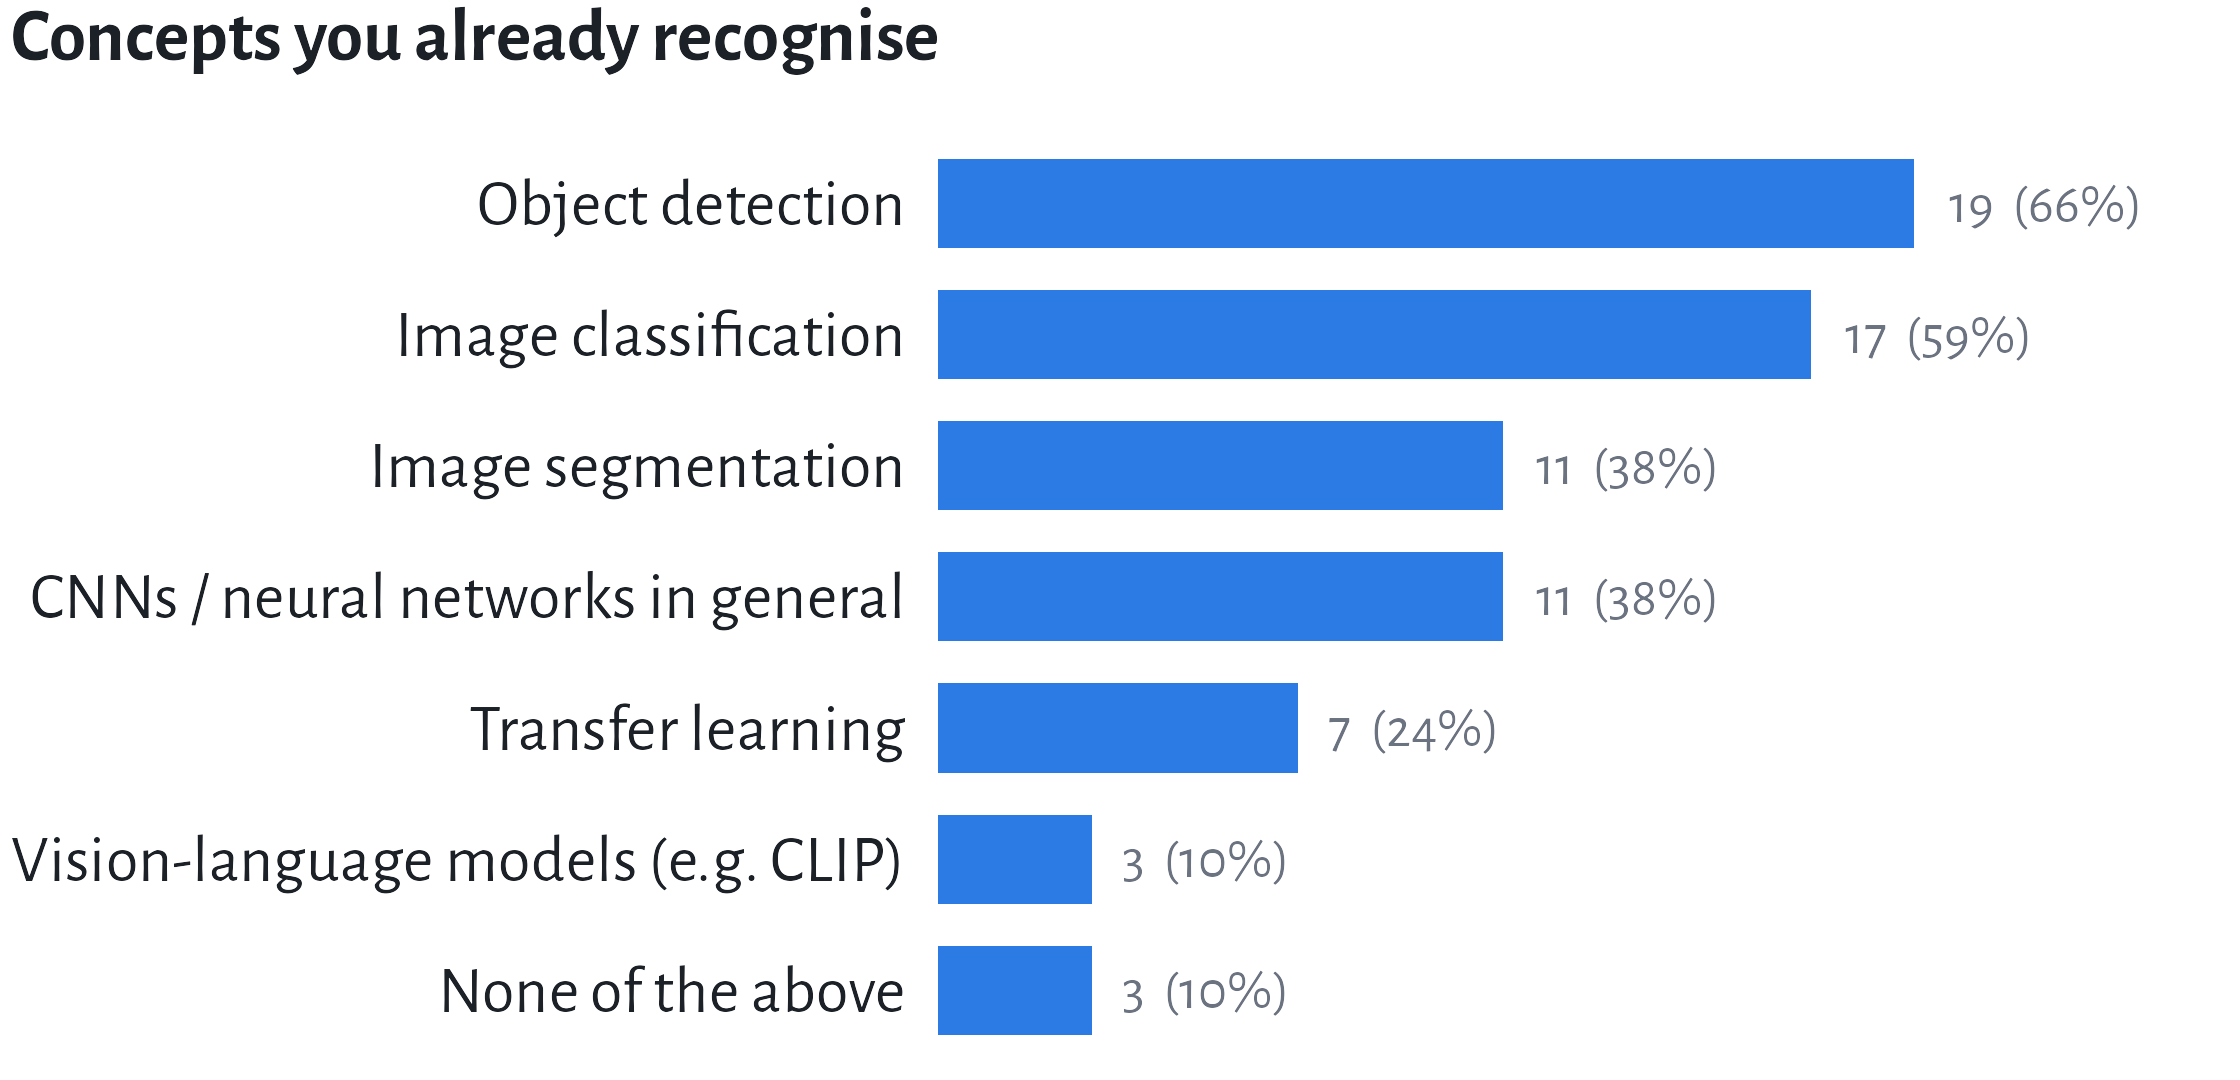
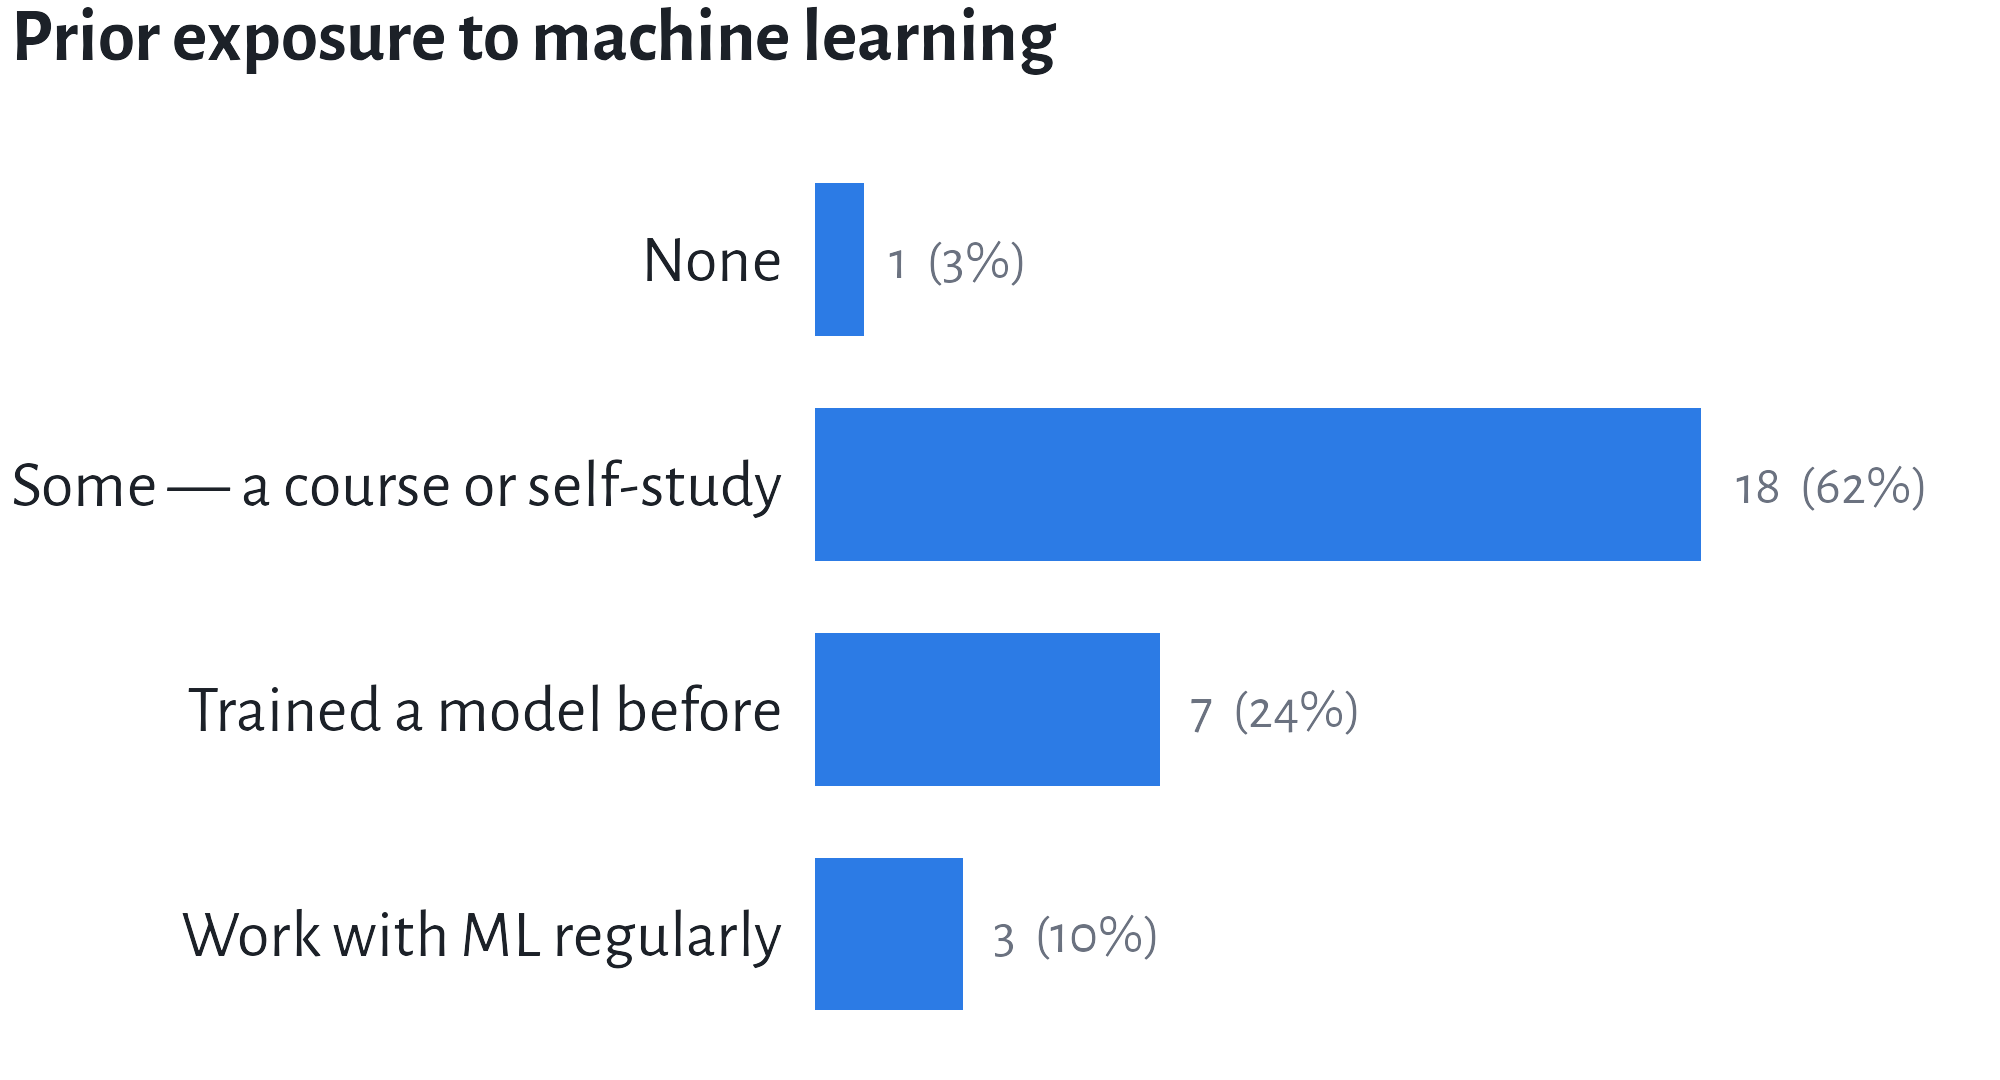
Almost everyone has met machine learning; almost nobody does it. You know the vocabulary of detection and classification.
What you want from the week
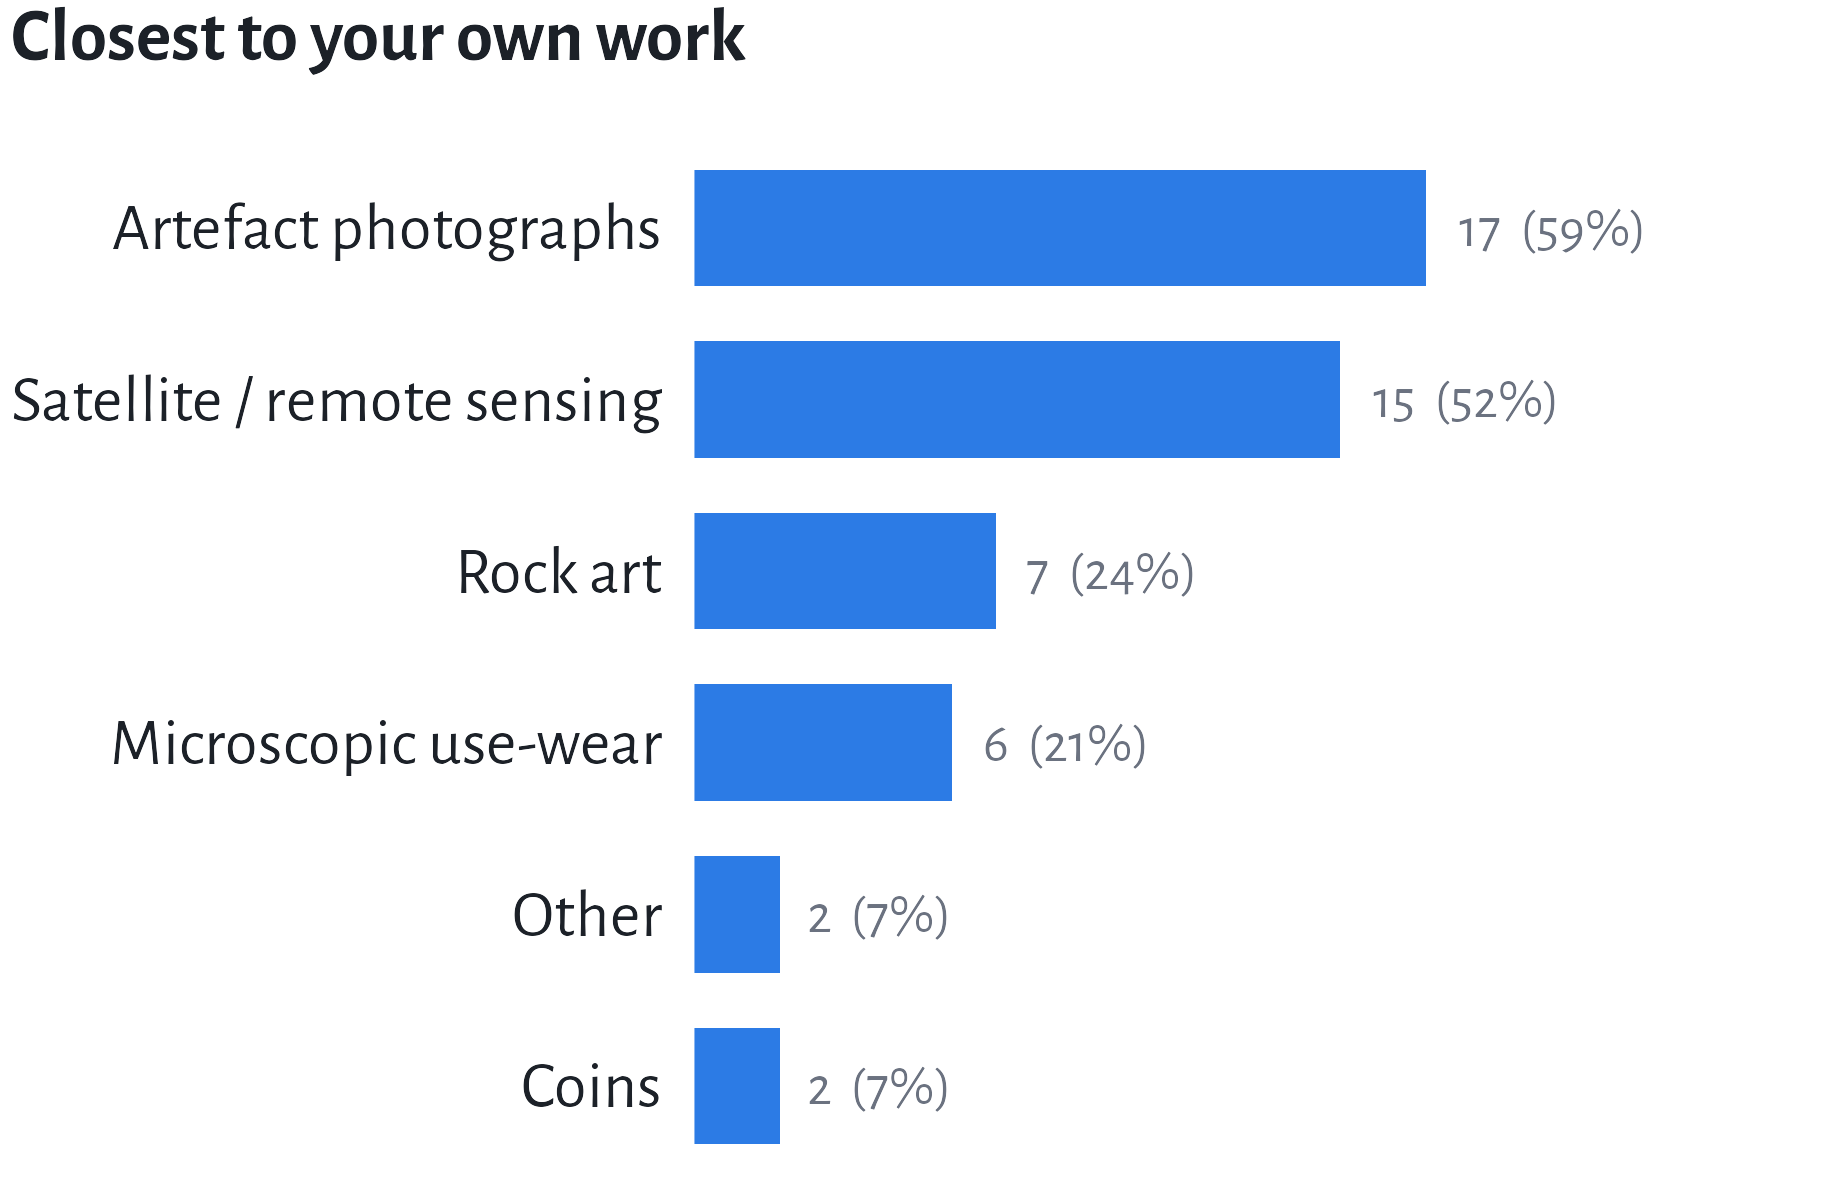
Multiple answers allowed. 48% have no dataset of their own to bring.
Confidently apply computer vision algorithms to detect archaeological features and micro-topographical anomalies, drastically reducing the manual processing time. (Árpád)
Better understand the inner workings of a machine learning model, by learning to develop and train it myself. (Aaricia)
Even if I don’t have a large corpus, I would like to test AI methods on my dataset by the end of the week. (Hüseyin)
An image is an array of numbers
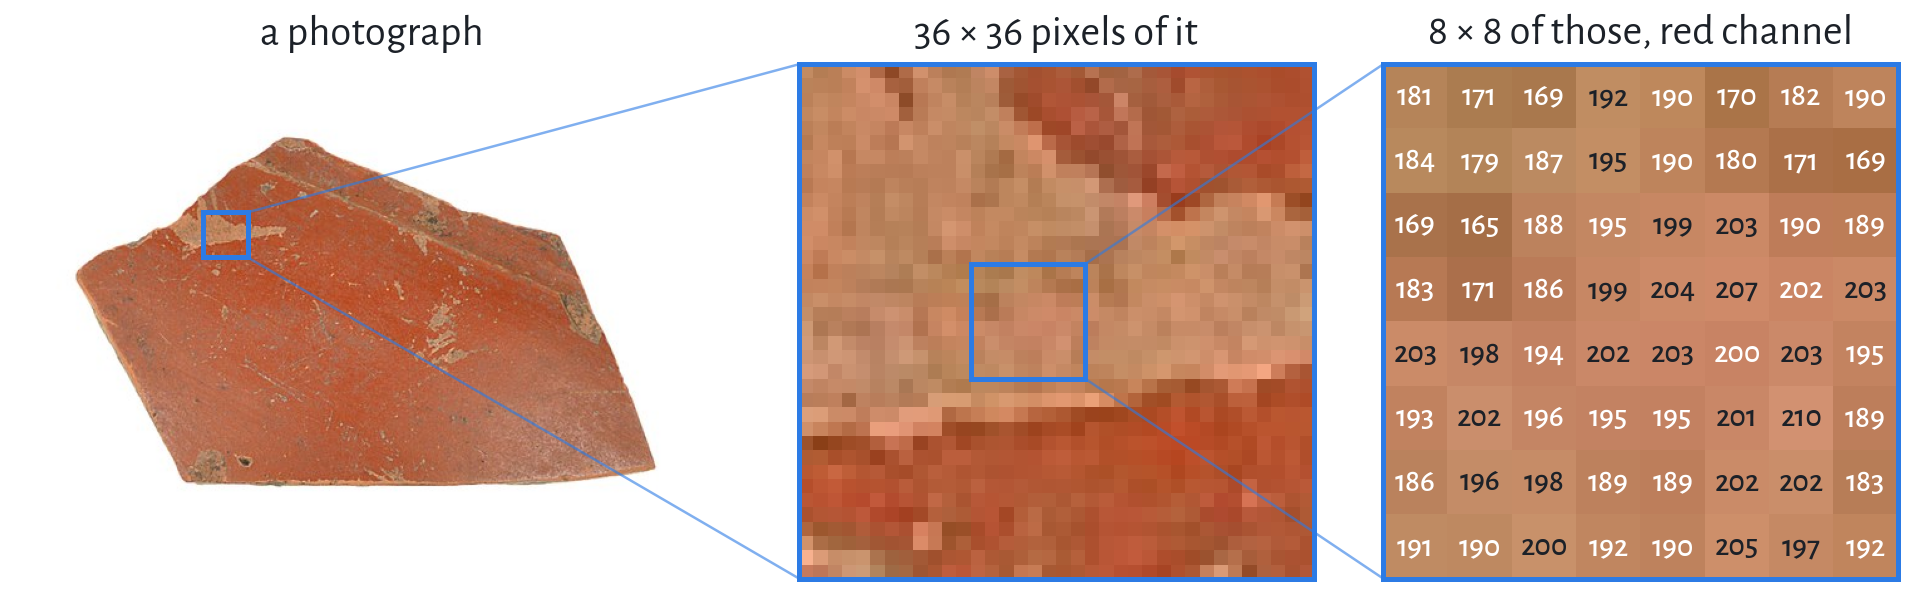
Sherd: AMČR M-202300130-N00020, CC BY-NC 4.0
A 4000 × 3000 photograph of a sherd is 12 million numbers per colour channel — 36 million in all. Nothing in that array says sherd, terra sigilata, or Roman period.
The semantic gap
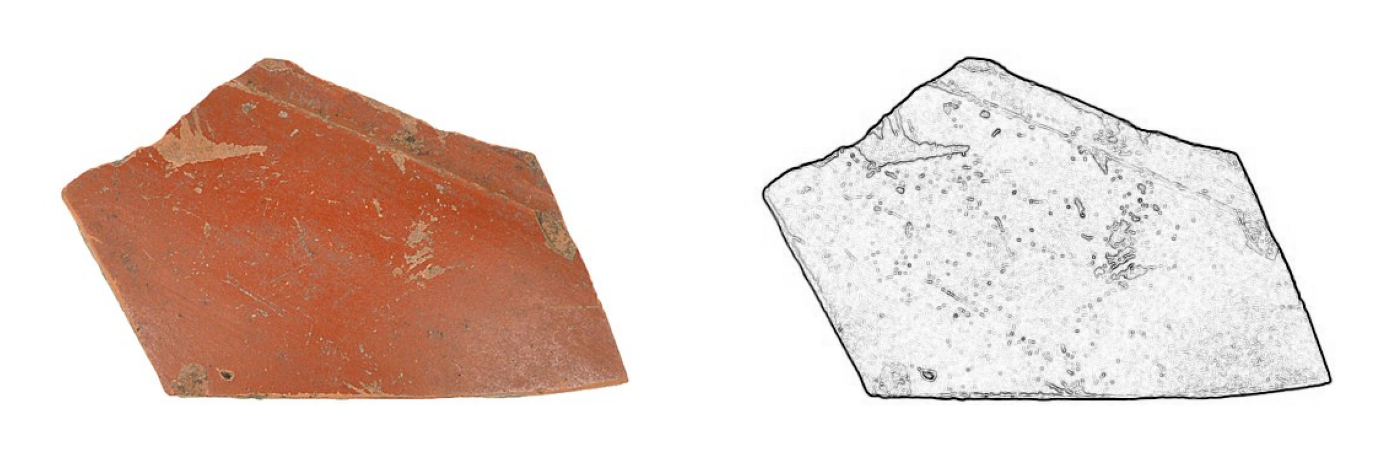
Sherd: AMČR M-202300130-N00020, CC BY-NC 4.0
A specialist sees
- a sherd
- Roman, terra sigilata from Rheinzabern
- 2nd half of the 2nd century CE
The computer receives
- a 4000 × 3000 × 3 array
- brightness gradients, edges, textures
- no notion of sherd
Bridging that gap with learned statistical regularities is the whole enterprise.
Why now?
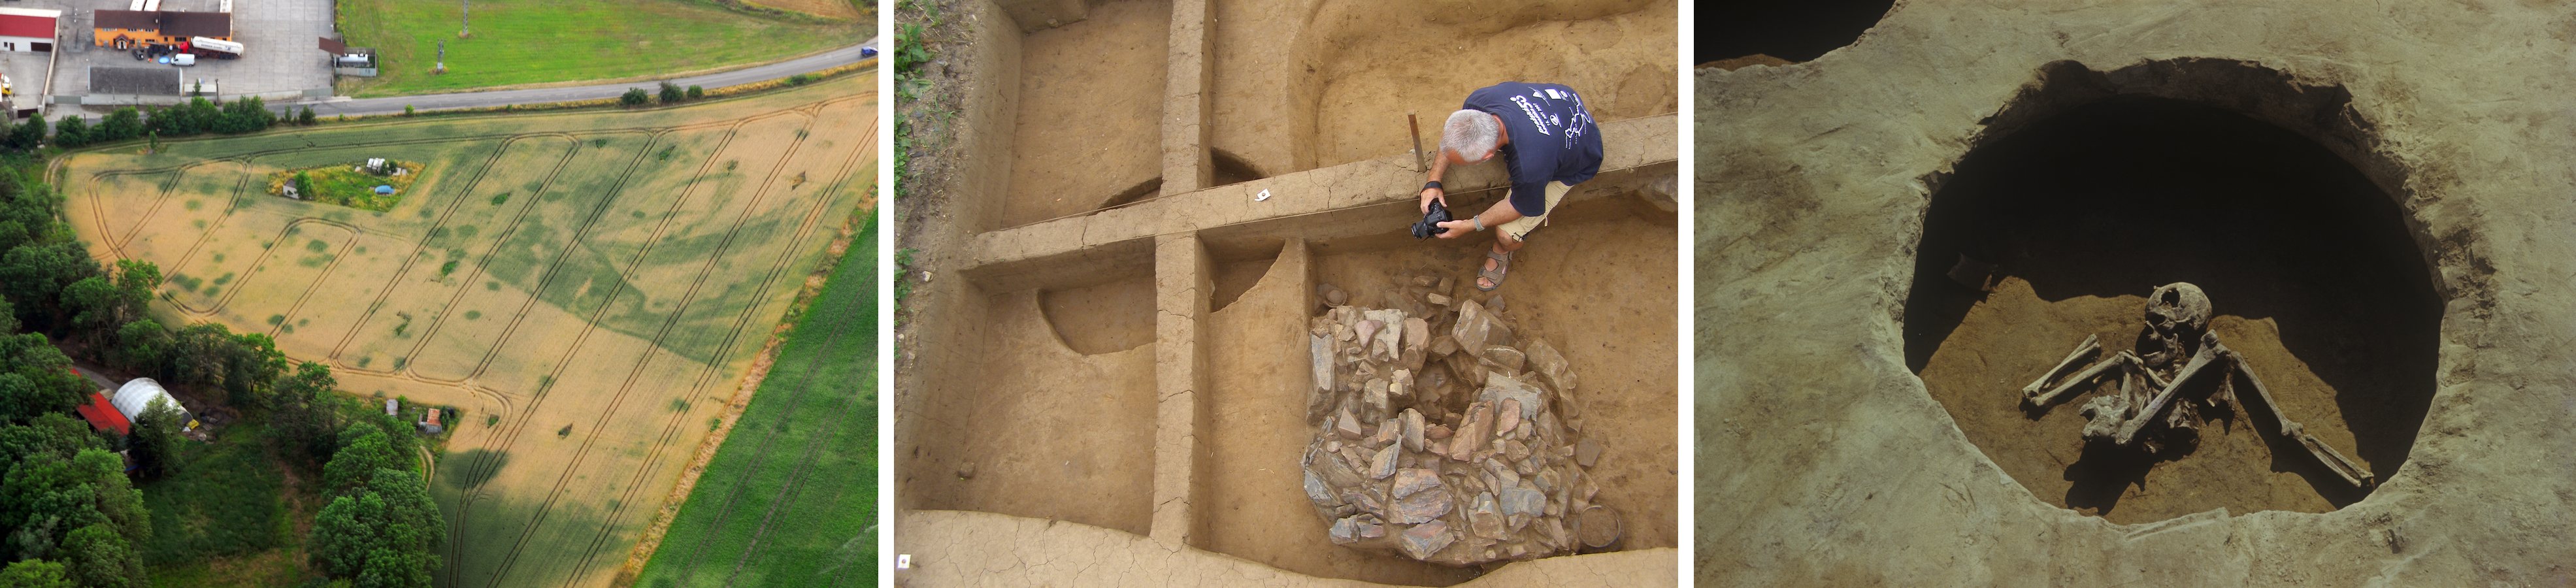
M. Gojda, AMČR C-DL-201000159; N. Profantová, AMČR C-200913914A-DT-05281; AMČR M-FT-900144861 (1984); CC BY-NC 4.0
- Excavation photography is born-digital and effectively free — thousands of frames per season
- Drone and satellite coverage is routine, not exceptional
- Digitisation programmes produce collections nobody has time to look through
- Pre-trained models mean you no longer need a million labelled images to start
The bottleneck moved from acquiring images to looking at them.
Four questions, four output shapes
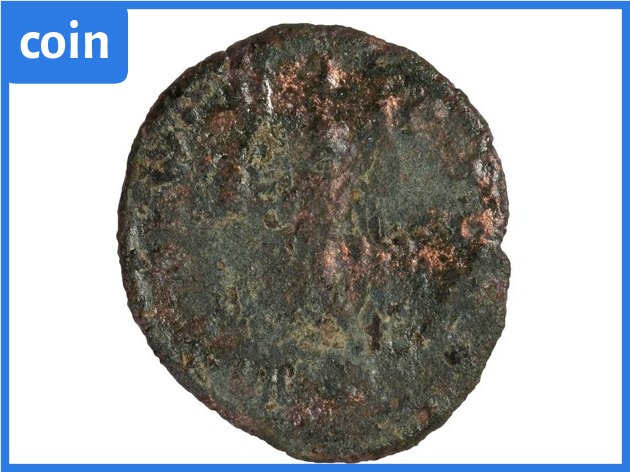
Classification
What is this?
One label per image
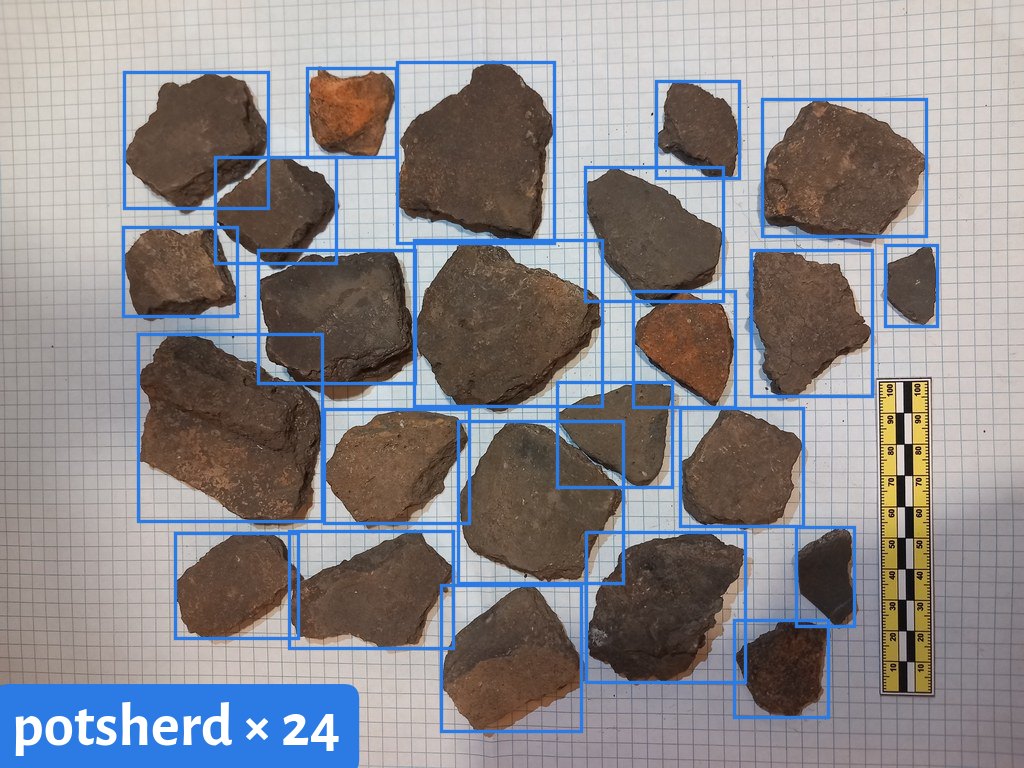
Detection
What, and where?
Boxes + labels
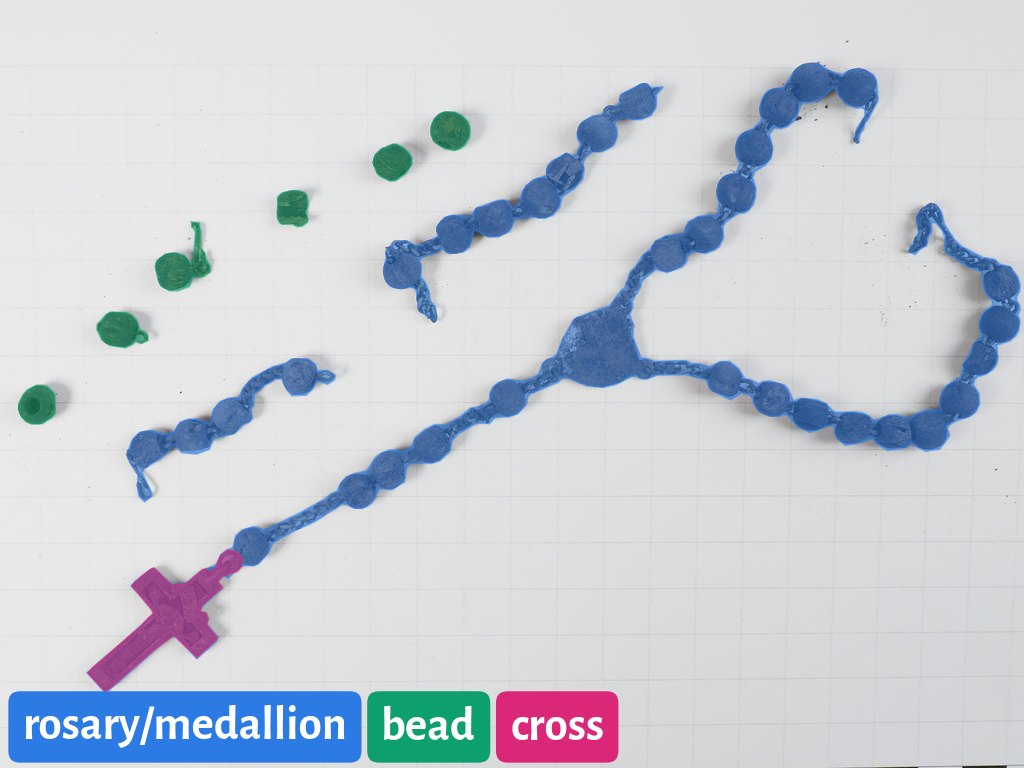
Segmentation
Which pixels?
Per-pixel mask
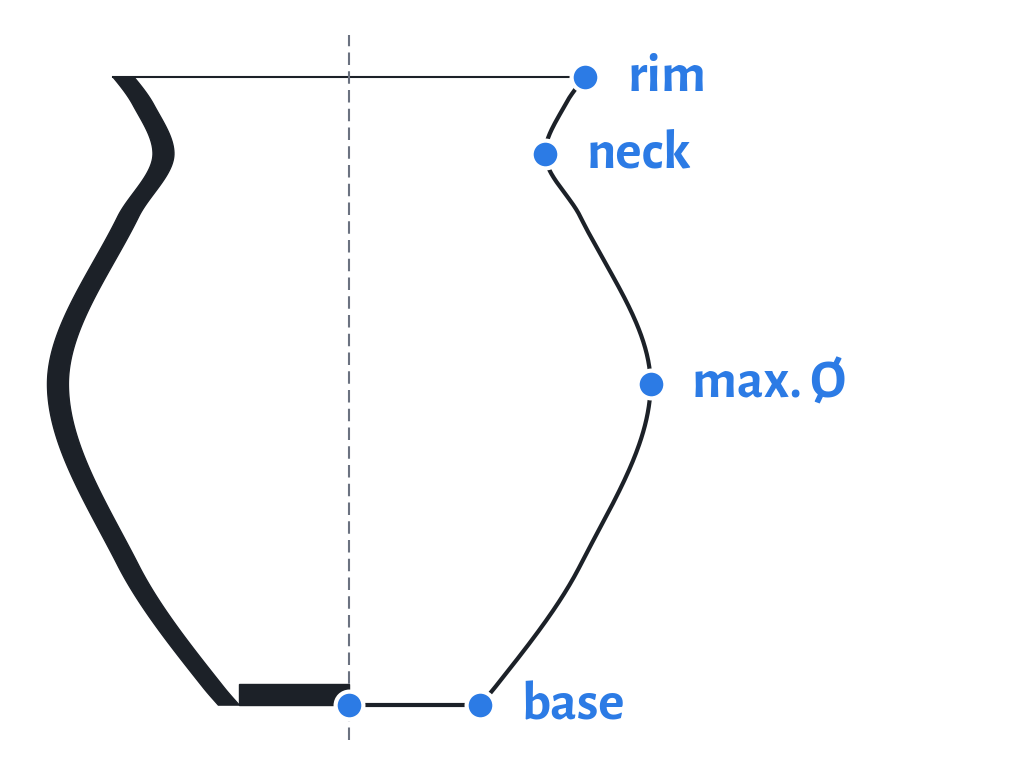
Keypoints
Where are the landmarks?
Coordinates
The choice is not technical. It follows from the question you asked — and it determines how much annotation you will have to pay for.
The pipeline for the rest of the week

| Stage | What you decide | When |
|---|---|---|
| Question | what would count as an answer? | today |
| Data & annotation | classes, vocabulary, licences | Tuesday |
| Pre-processing | scale, colour, augmentation | Wednesday |
| Training | architecture, transfer learning | Thursday |
| Evaluation | which errors you can live with | Thursday–Friday |
| Interpretation | what you may actually claim | Friday |
Projects fail at stage one or two. Almost never at stage four.
The same idea, drawn
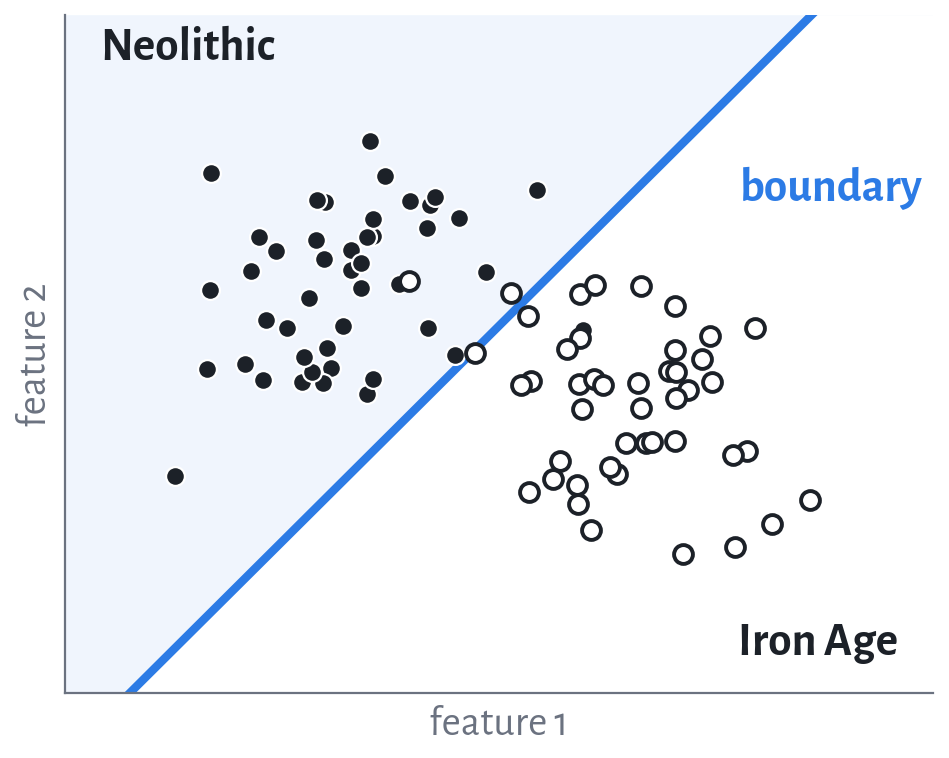
Discriminative — draw a line separating the classes. Anything far from the line is ignored.
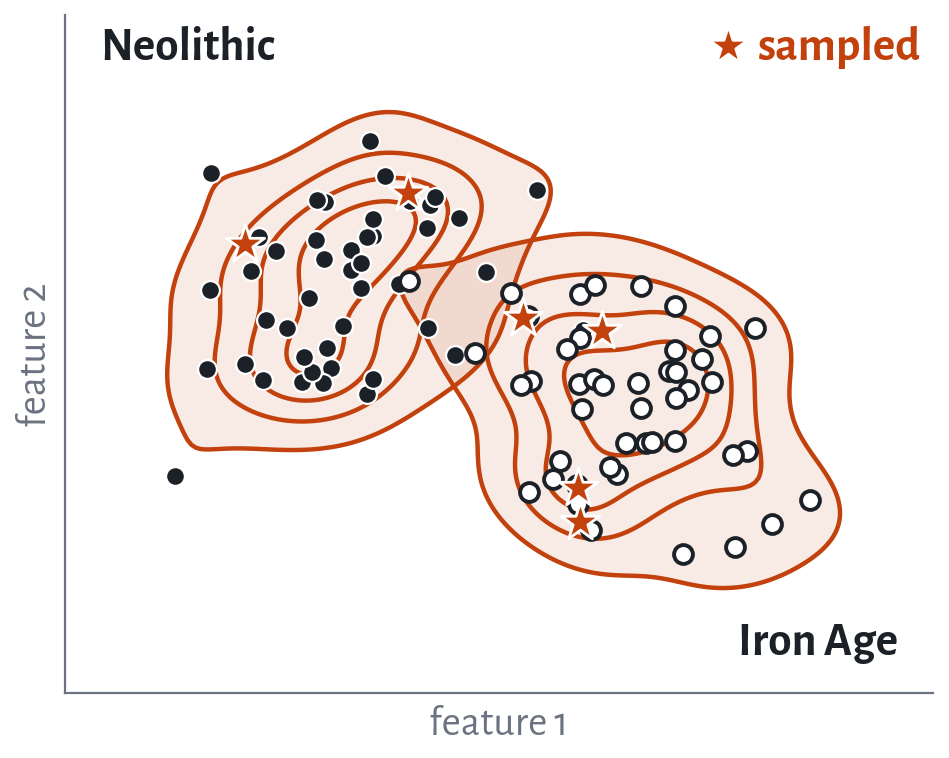
Generative — model where each class lives. You can then sample new points from it.
Discriminative — the working horse of the week
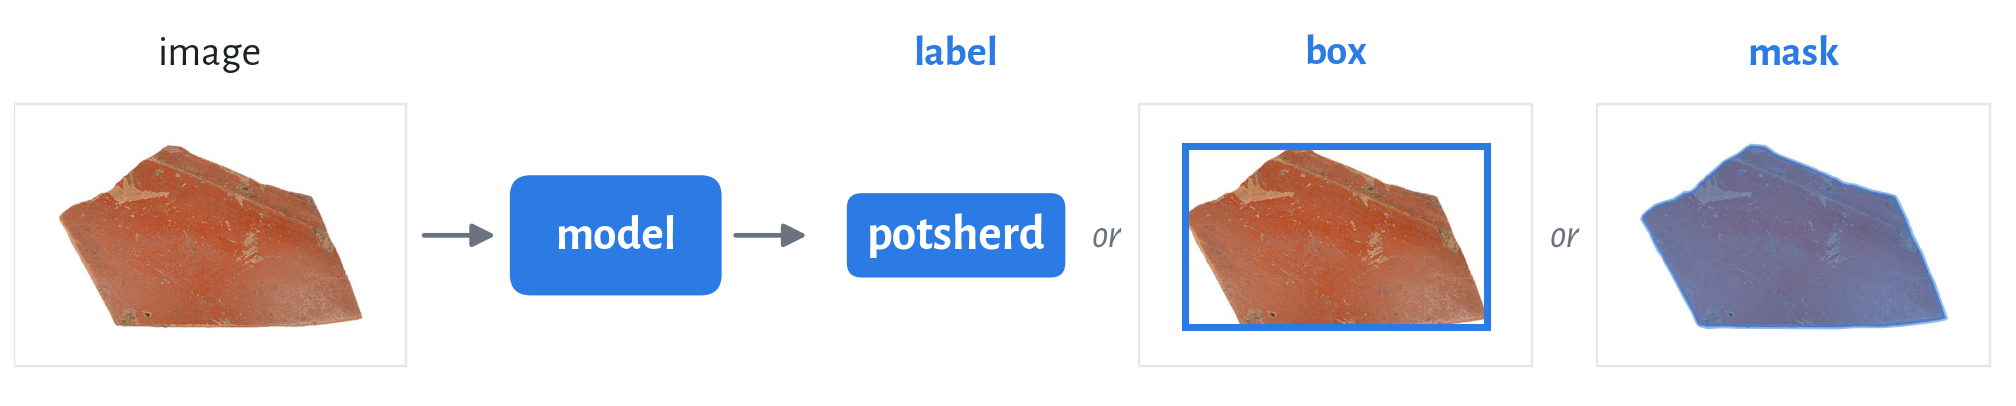
Sherd: AMČR M-202300130-N00020, CC BY-NC 4.0
- Artefact classification — a typological class for a photographed find
- Feature detection on LiDAR and satellite imagery — mounds, enclosures, field systems, hillforts
- Use-wear segmentation — the pixels showing a particular polish or striation
- Triage — separating scale-bar-only frames from find photographs
- Retrieval — “show me the twenty most similar sherds in the corpus”
Common thread: the model points at evidence that already exists.
Generative — a smaller part of the picture
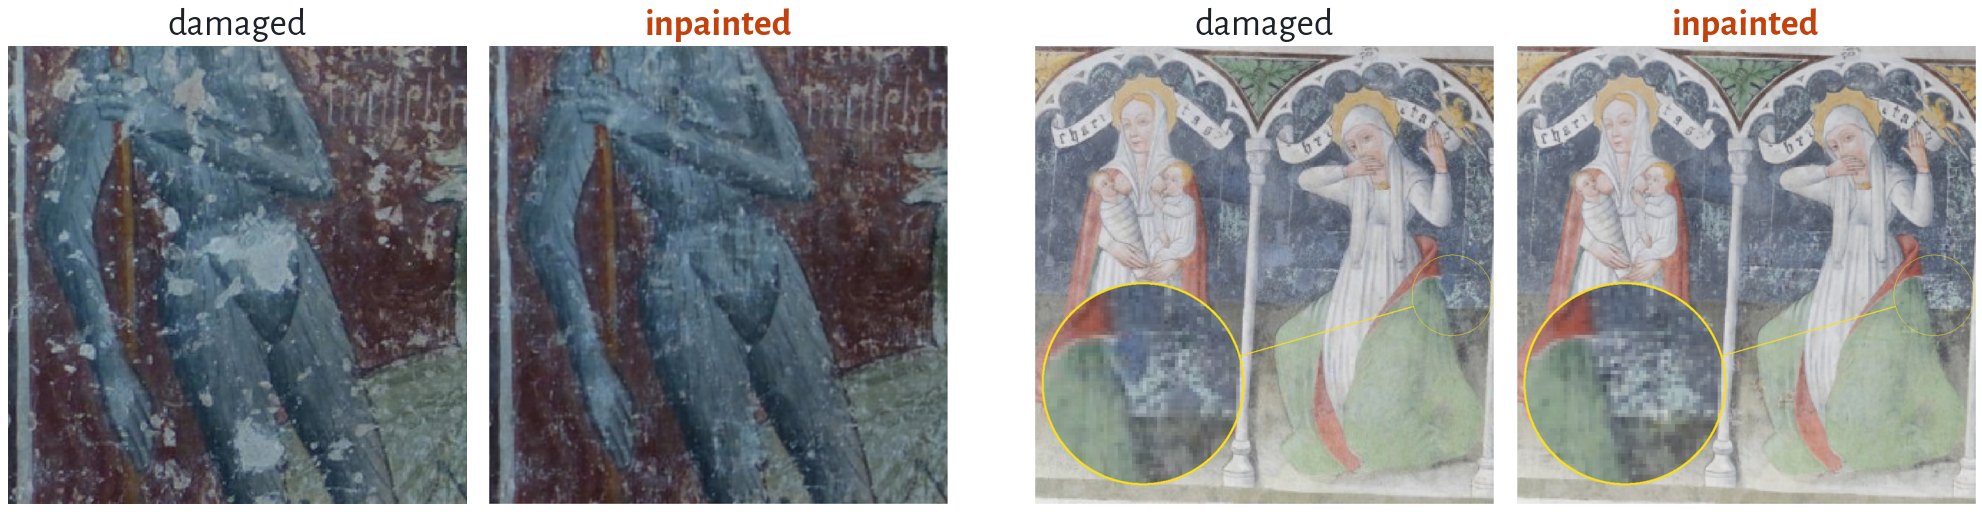
Merizzi et al. 2024, Heritage Science 12, 41, Figs. 12 & 17, doi:10.1186/s40494-023-01116-x, CC BY 4.0, modified
Restoration
Sharpening or completing degraded imagery, as above
Synthetic training data
Manufacturing examples for rare classes
Vision-language models
Describing an image, answering questions about it
Common thread: the model produces something that was not in the record.
What just happened?

Sherds: AMČR M-202300130-N00020; M. Španěl, AMČR M-202300087-N00486; CC BY-NC 4.0
- The model never saw an archaeological training set — it learned from image–caption pairs off the internet
- It is being used discriminatively (a label out) but was trained the way a generative model is
- Change the wording of a label and the answer changes — the vocabulary is now a parameter
- Give it only wrong options and it will still pick one, confidently
Important
Zero-shot is a superb way to explore a collection. It is a poor way to report a number.